Profiling
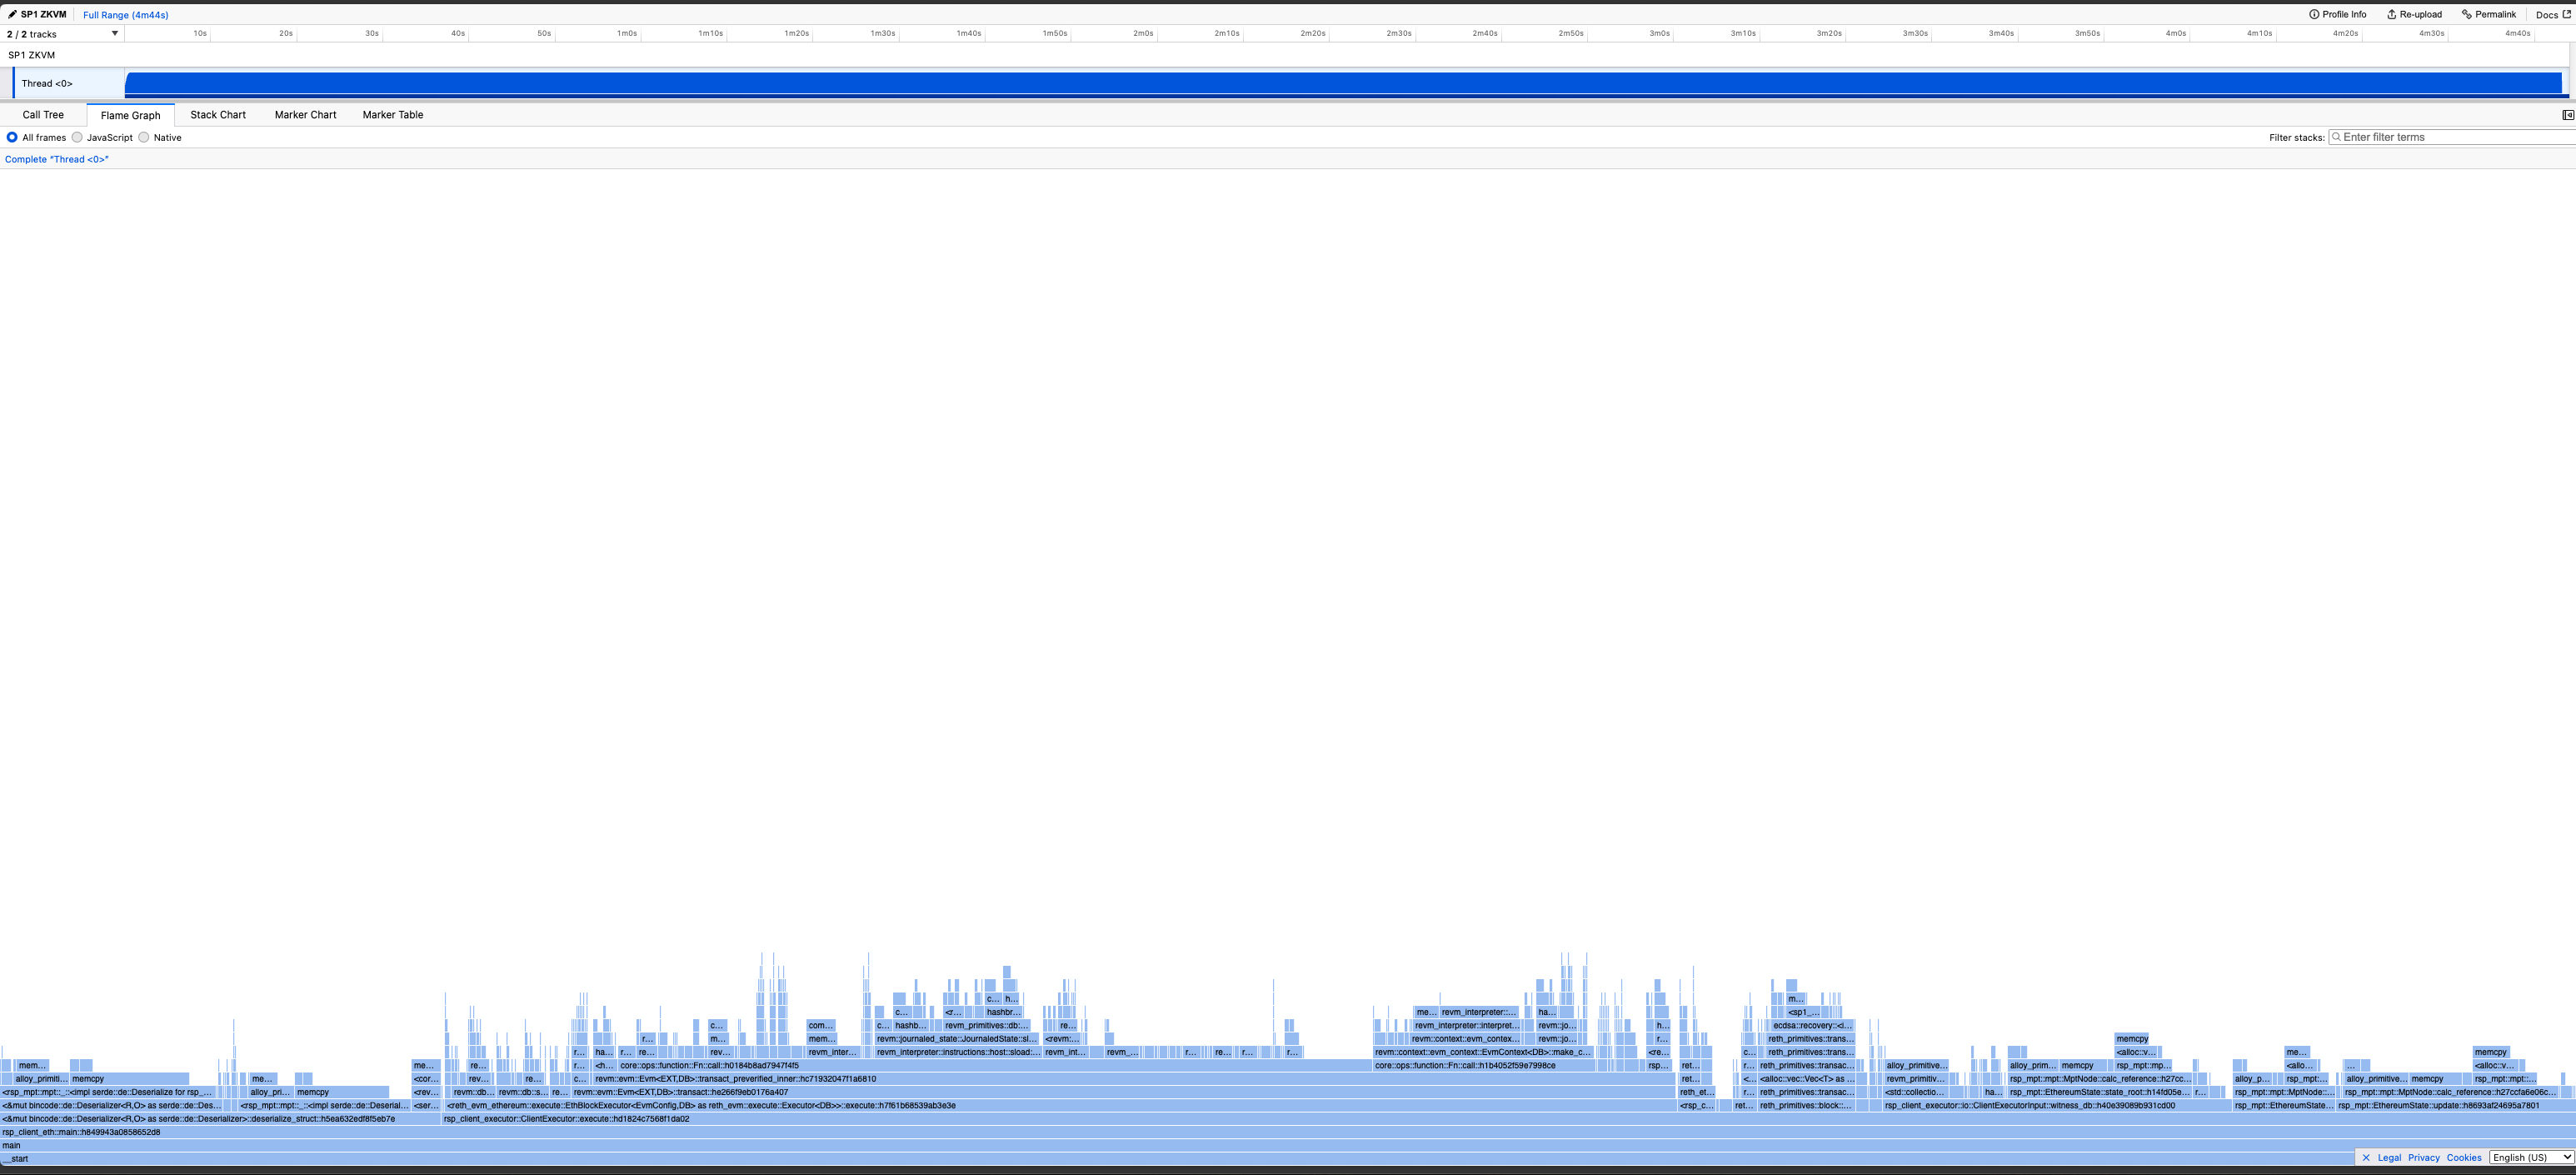
Profiling a zkVM program produces a useful visualization (example profile) which makes it easy to examine program performance and see exactly where VM cycles are being spent without needing to modify the program at all.
To profile a program, you need to:
- Enable the profiling feature for
sp1-sdkinscript/Cargo.toml - Set the env variable
TRACE_FILE=trace.jsonand then callProverClient::execute()in your script.
If you're executing a larger program (>100M cycles), you should set TRACE_SAMPLE_RATE to reduce the size of the trace file. A sample rate of 1000 means that 1 in every 1000 VM cycles is sampled. By default, every cycle is sampled.
Many examples can be found in the repo, such as this 'fibonacci' script.
Once you have your script it should look like the following:
    // Execute the program using the `ProverClient.execute` method, without generating a proof.
    let (_, report) = client.execute(ELF, &stdin).run().unwrap();
You must enable the profiling feature on the SDK as well:
sp1-sdk = { version = "6.1.0", features = ["profiling"] }
The TRACE_FILE env var tells the executor where to save the profile, and the TRACE_SAMPLE_RATE env var tells the executor how often to sample the program.
A larger sample rate will give you a smaller profile, it is the number of instructions in between each sample.
The full command to profile should look something like this
TRACE_FILE=output.json TRACE_SAMPLE_RATE=100 cargo run ...
To view these profiles, we recommend Samply.
    cargo install --locked samply
    samply load output.json
Samply uses the Firefox profiler to create a nice visualization of your program's execution.
Interpreting the Profile
-
The "time" measurement in the profiler is actually the number of cycles spent, in general the fewer cycles for a given callframe the better.
-
The CPU usage of the program will always be constant, as it's running in the VM which is single threaded.