Prover Gas
Overview
Prover gas is a more accurate metric for estimating the real proving "costs" of an SP1 program introduced in versions >= 4.1.4. The metric incorporates RISC-V cycle count and the different cost profiles of precompiles to help developers profile estimated proving cost with much greater accuracy when executing programs.
Usage
When calling ProverClient::execute(), the executor will track the prover gas used for the program. The ExecutionReport returned by the ProverClient::execute() method contains the prover gas used for the execution of the program.
Prover gas has been roughly calibrated to be of a similar magnitude to RISC-V cycle count.
let client = ProverClient::from_env();
let (_, report) = client.execute(ELF, &stdin).run().unwrap();
let prover_gas = report.gas.unwrap_or(0);
Cycle tracking is the best way to profile components of your program for their proving cost. Prover gas is a more accurate metric for estimating the proving cost of a program, but is only availableonce the full program has been executed.
Methodology
Existing Metric: RISC-V Cycle Count
Historically, developers have used the RISC-V cycle count of a program as a proxy for its work. Cycle counts have several benefits: the cycle count is easily computable during the execution step of the zkVM, which runs through the program’s RISC-V instructions in sequence. SP1 already allows developers to easily measure cycle counts during development.
However, cycle counts are not a perfect proxy for the work required to generate a proof.
For example, consider the following figure comparing prover gas to cycle count across a variety of programs, from simple programs like Loop and Fibonacci to more complex ones like ECDSA recovery and Tendermint consensus verification:
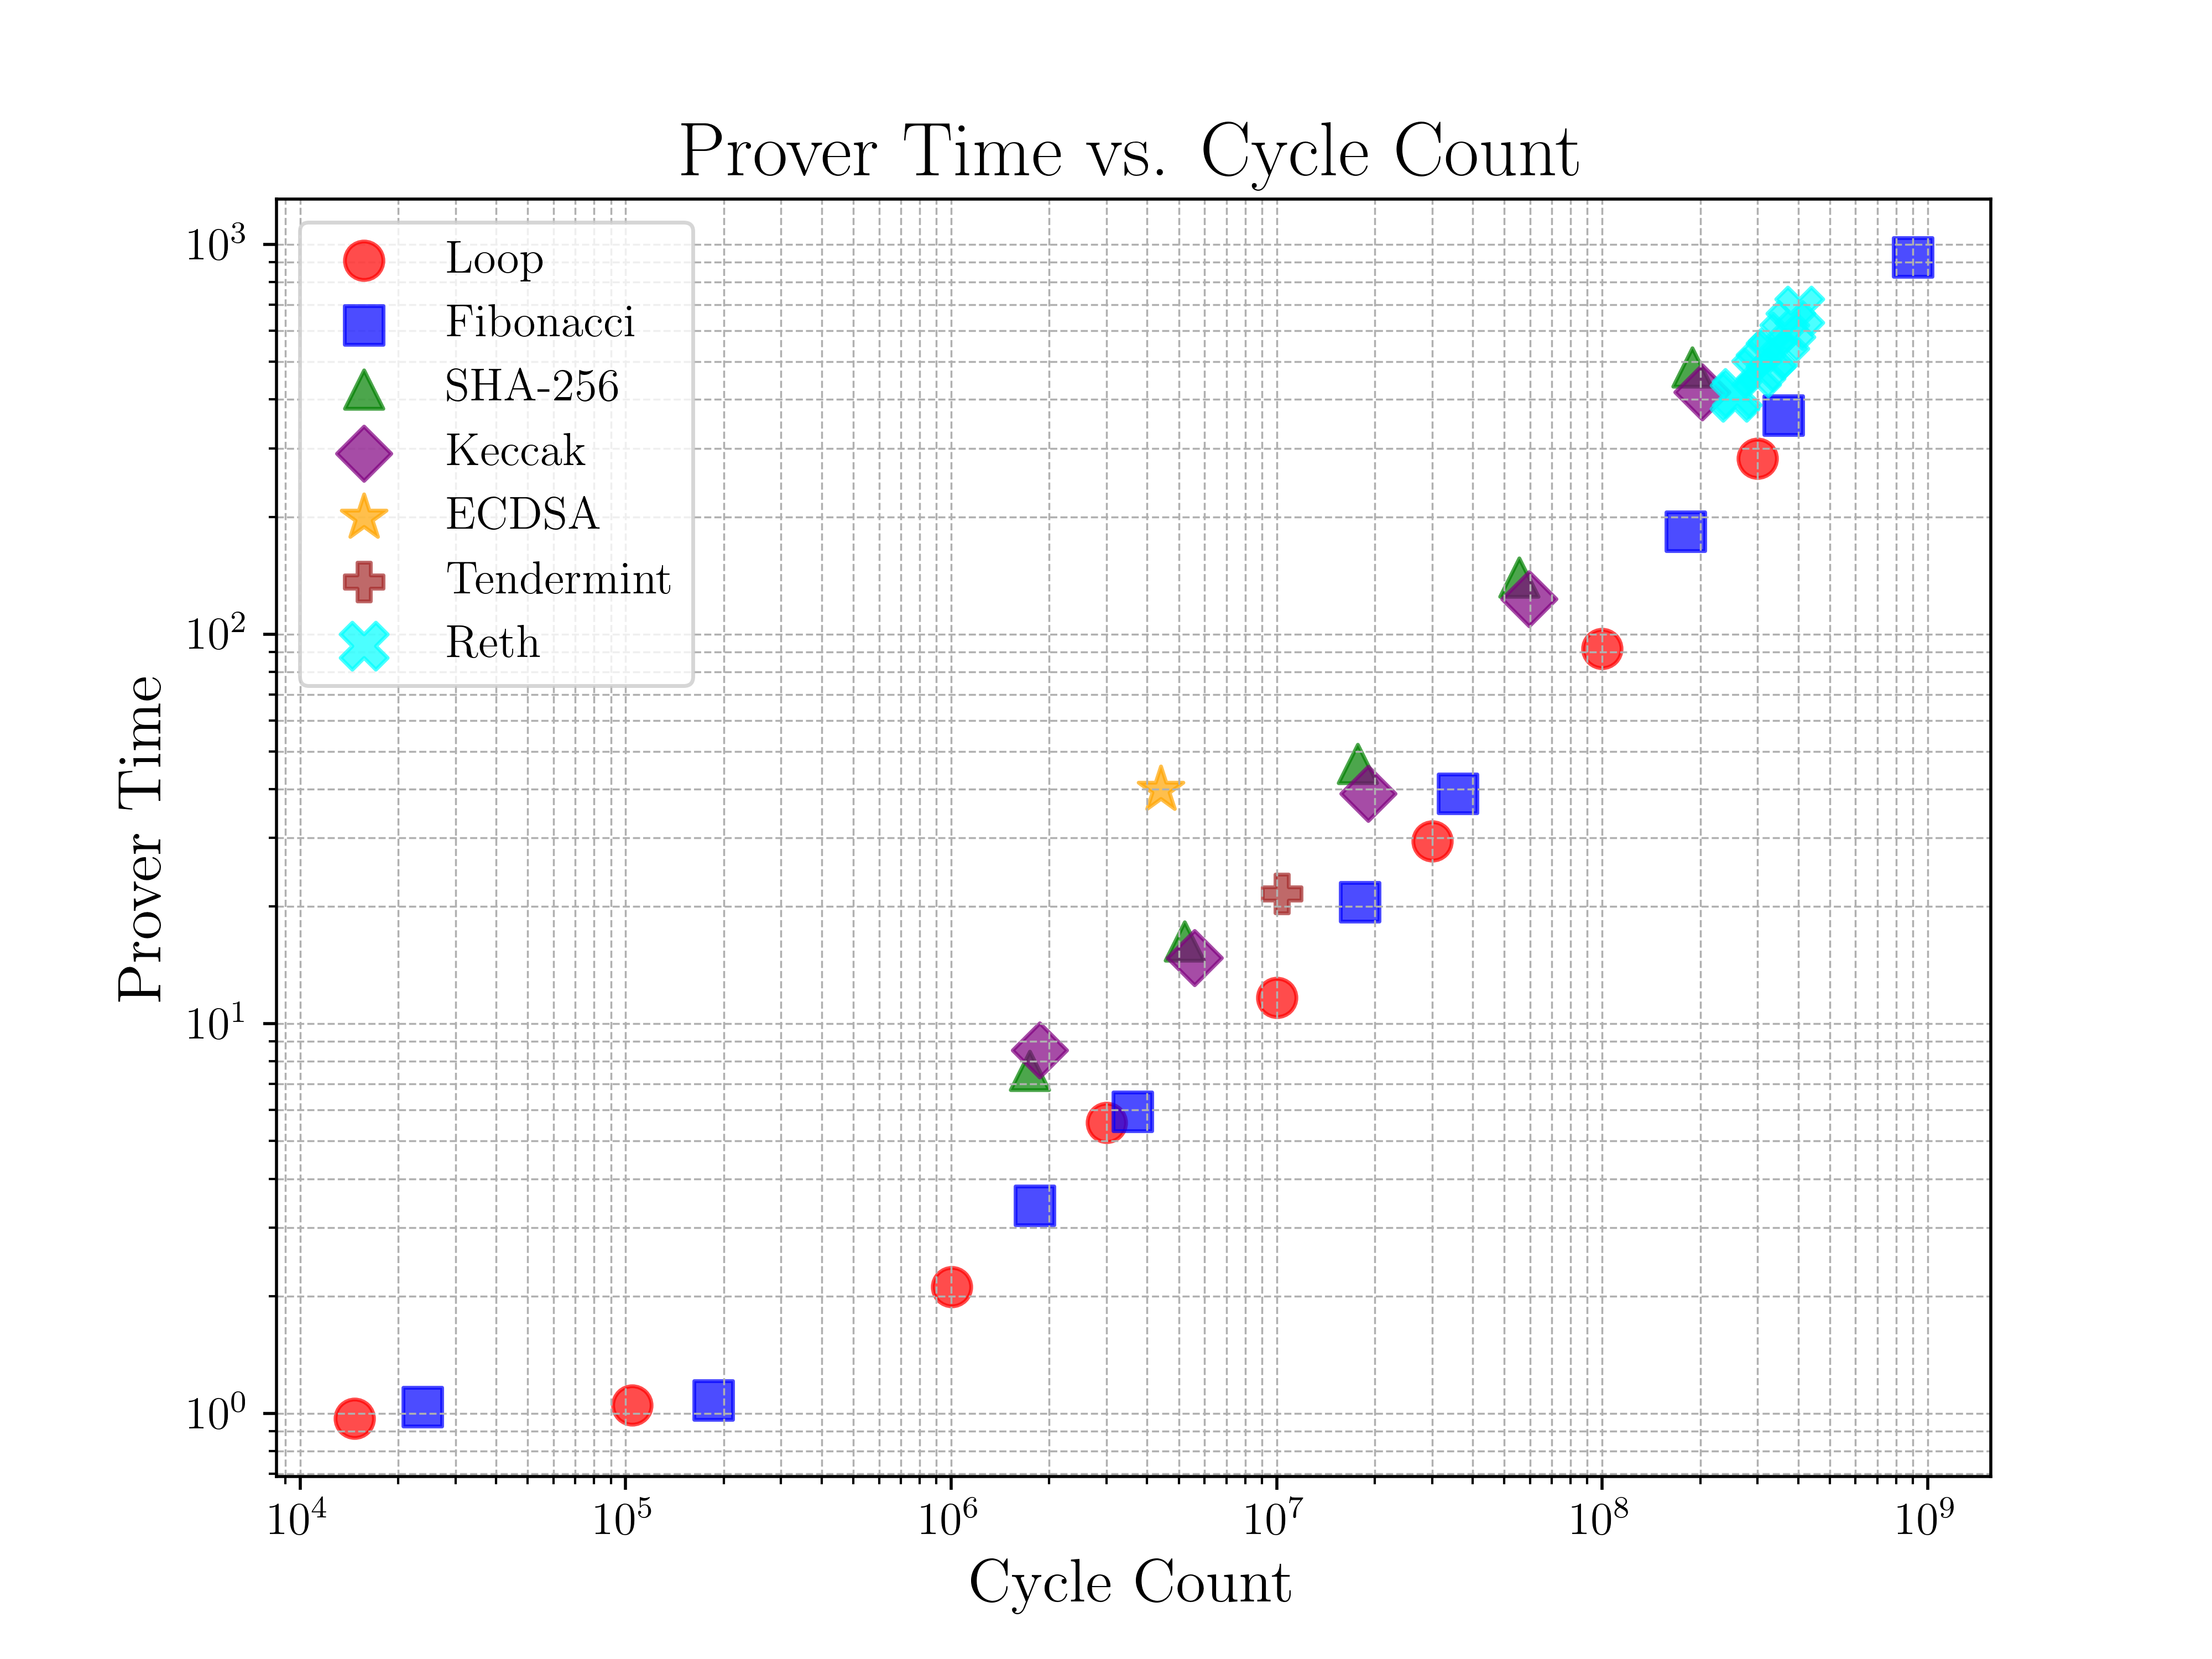
This analysis shows several interesting features. Two programs of the same cycle counts may require significantly different proving times. For example, although keccak256-300kb constitutes more cycles (at approximately 5.6 million cycles) than ECDSA recovery (at approximately 4.4 million cycles), ECDSA recovery takes more than twice the amount of proving time. Further, we observe “clusters” of programs have their own scaling laws in proving time; Keccak and Reth, for example, require increased proving time for their cycle counts than other programs of similar size. These examples illustrate the need for a more reliable measure of work for developers that better predicts proving costs.
New Metric: Prover Gas
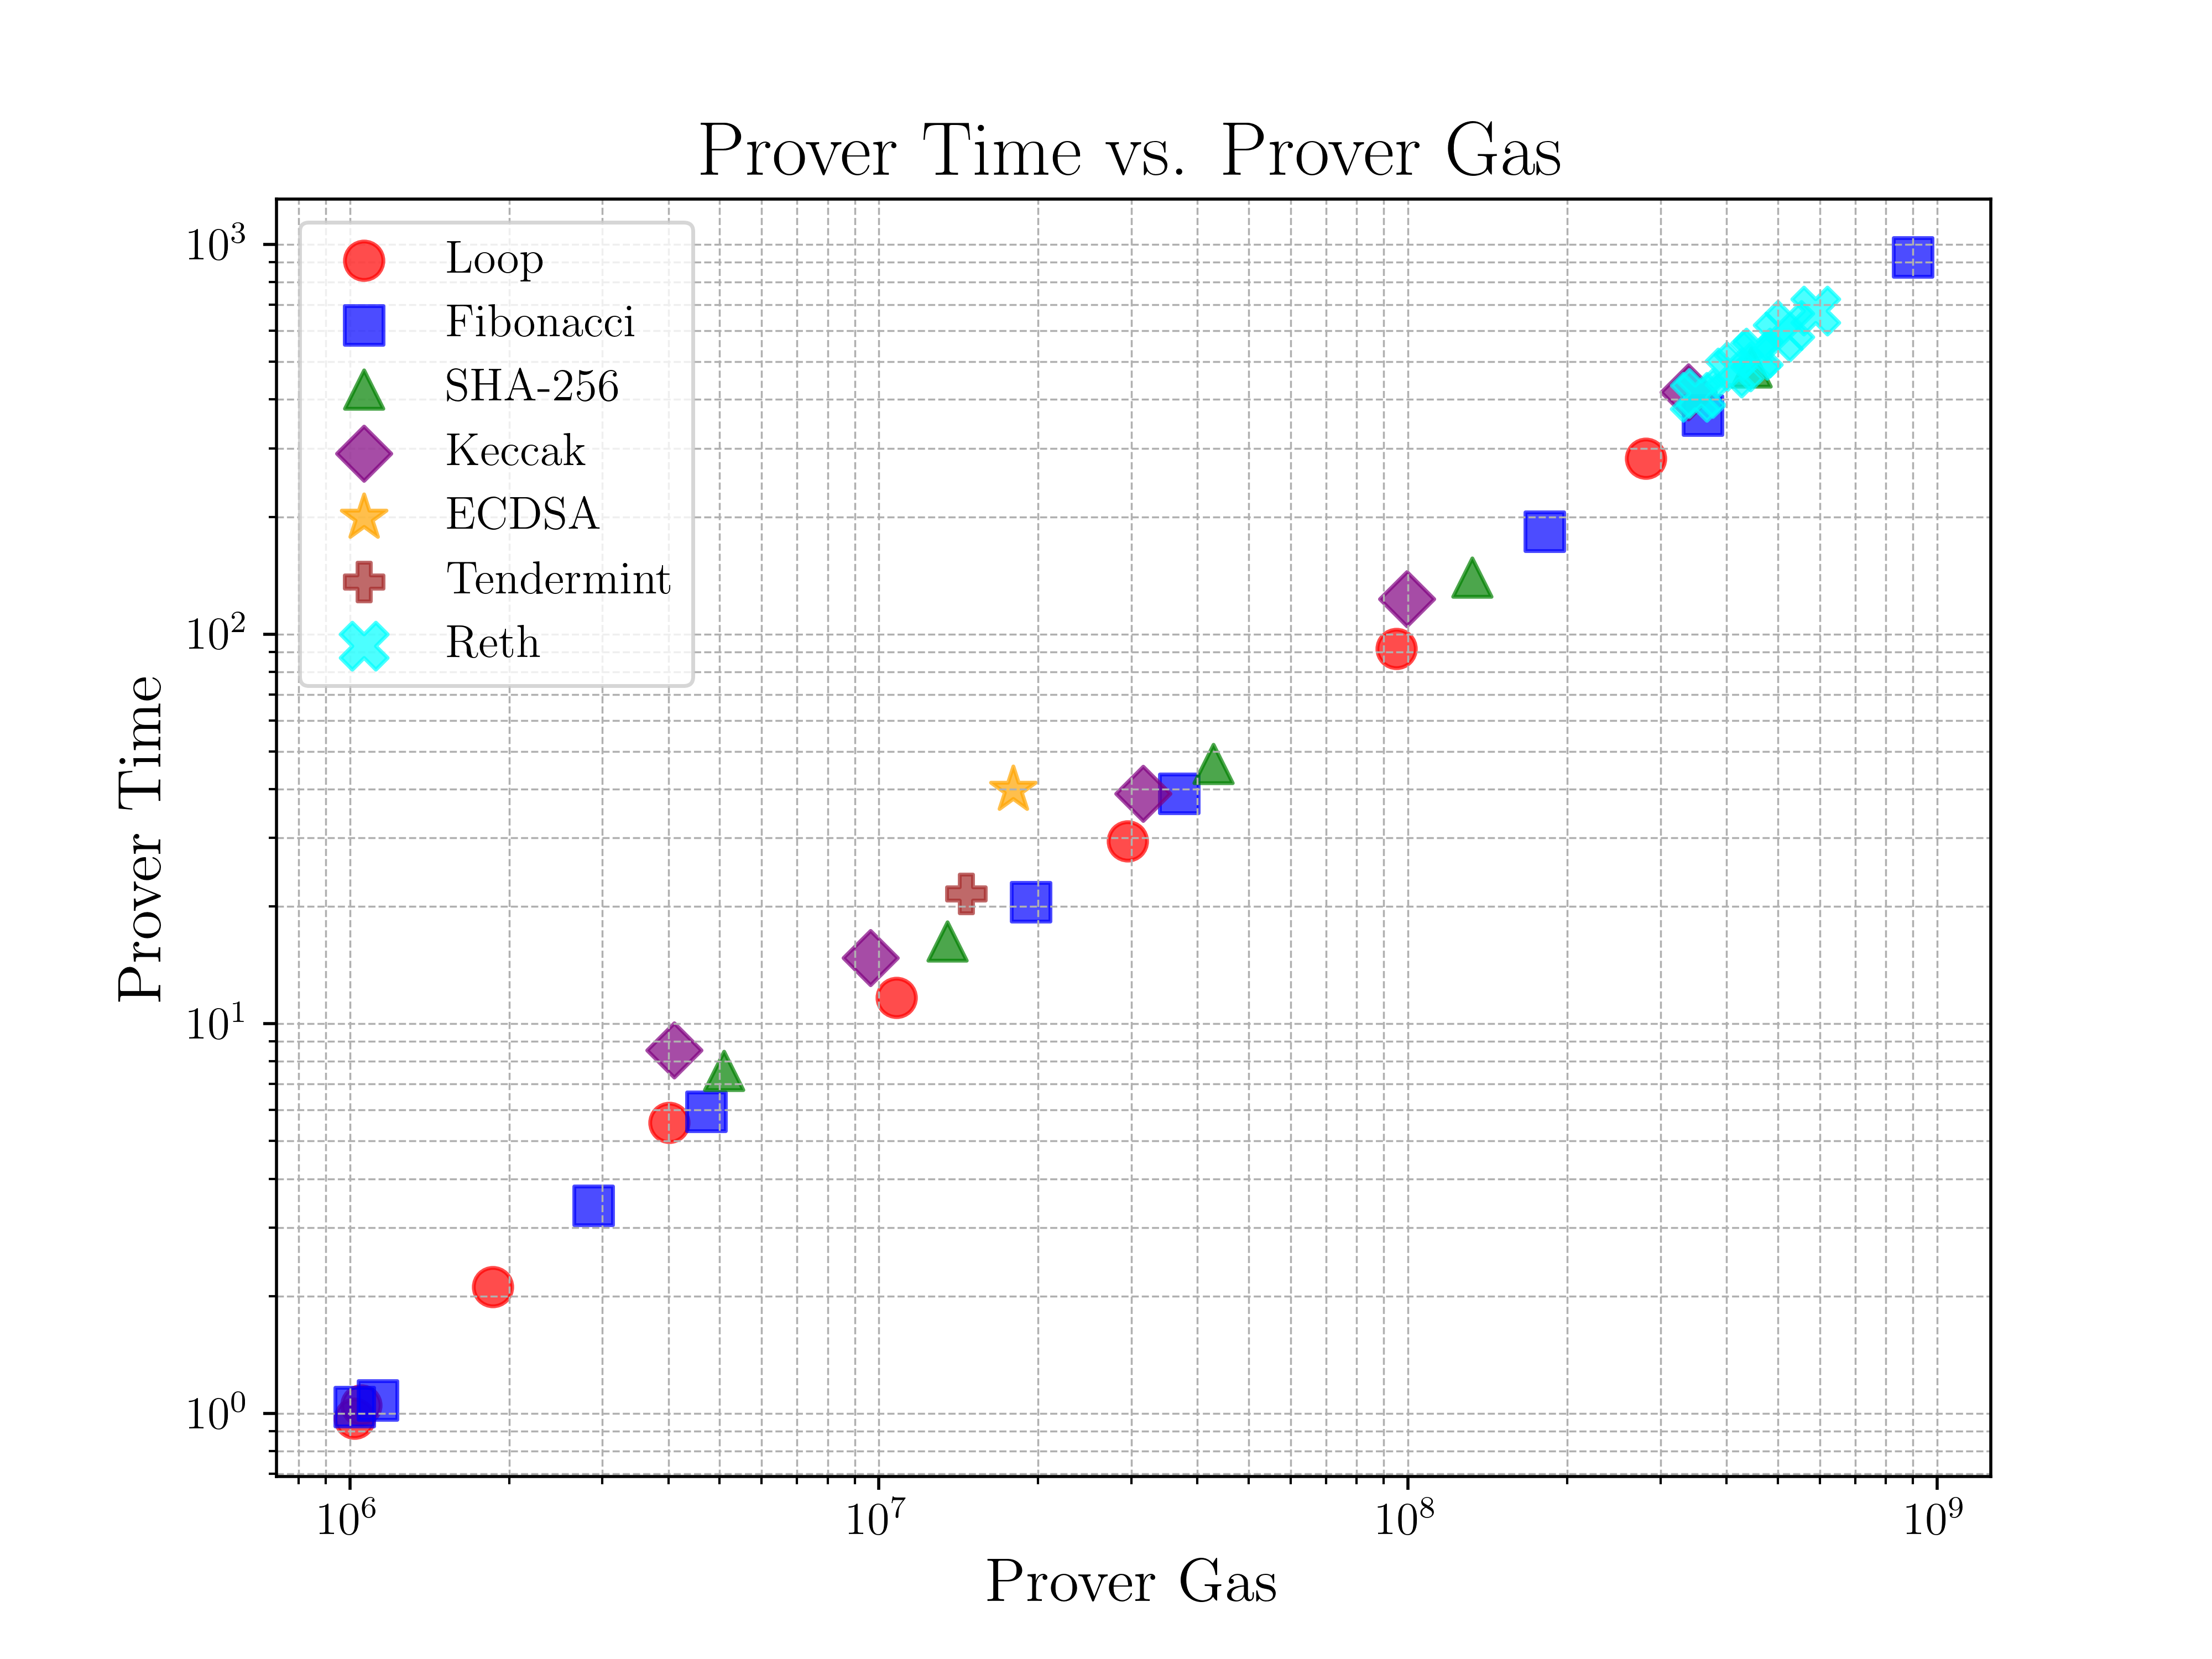
Prover gas effectively predicts real GPU proving time across a range of programs, giving developers a single, reliable metric which they can use to profile their programs end to end. The below figure shows the efficacy of this metric for the previously considered programs. Importantly, there are no clustering effects and programs of similar prover gas do not have dramatically different proving times. This fit allows developers to use prover gas as a proxy for real costs they face while proving.
Technical Implementation
In SP1, proving a program’s execution is done in several stages. There is a core stage where the program’s execution is broken up into sections called shards each of which are proven alone. In the recursion stage, pairs of shards have their proofs and initial and final program states verified. This procedure itself is a program that is proved, and the process continues until we finally have one proof for the whole program execution.
Prover gas is based around a model to predict the proving time for each core shard. The model uses linear regression to predict core GPU time given the shape of the core shard. The shape consists of two values for each chip: the padded height of its trace and the base 2 logarithm of this quantity. While proving, these shapes are determined by the traces by padding each chip’s trace so the collection of trace heights for each chip is “allowed.” For cryptographic reasons, SP1 V4 comes with a large collection of “allowed” shapes, which each shard must match to proceed to the next proving stage.
The predictions for each core shard are summed up and transformed with a scaling factor to compute the prover gas. The model is fit to a dataset composed of a wide range of shards and their core GPU times.