Cycle Tracking
When writing a program, it is useful to know how many RISC-V cycles a portion of the program takes to identify potential performance bottlenecks. SP1 provides a way to track the number of cycles spent in a portion of the program.
Tracking Cycles with Annotations
To track the number of cycles spent in a portion of the program, you can either put println!("cycle-tracker-start: block name") + println!("cycle-tracker-end: block name") statements (block name must be same between start and end) around the portion of your program you want to profile or use the #[sp1_derive::cycle_tracker] macro on a function. An example is shown below:
#![no_main]
sp1_zkvm::entrypoint!(main);

#[sp1_derive::cycle_tracker]
pub fn expensive_function(x: usize) -> usize {
    let mut y = 1;
    for _ in 0..100 {
        y *= x;
        y %= 7919;
    }
    y
}

pub fn main() {
    let mut nums = vec![1, 1];

    // Setup a large vector with Fibonacci-esque numbers.
    println!("cycle-tracker-start: setup");
    for _ in 0..100 {
        let mut c = nums[nums.len() - 1] + nums[nums.len() - 2];
        c %= 7919;
        nums.push(c);
    }
    println!("cycle-tracker-end: setup");

    println!("cycle-tracker-start: main-body");
    for i in 0..2 {
        let result = expensive_function(nums[nums.len() - i - 1]);
        println!("result: {}", result);
    }
    println!("cycle-tracker-end: main-body");
}
Note that to use the macro, you must add the sp1-derive crate to your dependencies for your program.
[dependencies]
sp1-derive = "3.0.0"
In the script for proof generation, setup the logger with utils::setup_logger() and run the script with RUST_LOG=info cargo run --release. You should see the following output:
$ RUST_LOG=info cargo run --release
    Finished release [optimized] target(s) in 0.21s
     Running `target/release/cycle-tracking-script`
2024-03-13T02:03:40.567500Z  INFO execute: loading memory image
2024-03-13T02:03:40.567751Z  INFO execute: starting execution
2024-03-13T02:03:40.567760Z  INFO execute: clk = 0 pc = 0x2013b8
2024-03-13T02:03:40.567822Z  INFO execute: ┌╴setup
2024-03-13T02:03:40.568095Z  INFO execute: └╴4,398 cycles
2024-03-13T02:03:40.568122Z  INFO execute: ┌╴main-body
2024-03-13T02:03:40.568149Z  INFO execute: │ ┌╴expensive_function
2024-03-13T02:03:40.568250Z  INFO execute: │ └╴1,368 cycles
stdout: result: 5561
2024-03-13T02:03:40.568373Z  INFO execute: │ ┌╴expensive_function
2024-03-13T02:03:40.568470Z  INFO execute: │ └╴1,368 cycles
stdout: result: 2940
2024-03-13T02:03:40.568556Z  INFO execute: └╴5,766 cycles
2024-03-13T02:03:40.568566Z  INFO execute: finished execution clk = 11127 pc = 0x0
2024-03-13T02:03:40.569251Z  INFO execute: close time.busy=1.78ms time.idle=21.1µs
Note that we elegantly handle nested cycle tracking, as you can see above.
Get Tracked Cycle Counts
To include tracked cycle counts in the ExecutionReport when using ProverClient::execute, use the following annotations:
fn main() {
  println!("cycle-tracker-report-start: block name");
  // ...
  println!("cycle-tracker-report-end: block name");
}
This will log the cycle count for block name and include it in the ExecutionReport in the cycle_tracker map.
Profiling a ZKVM program
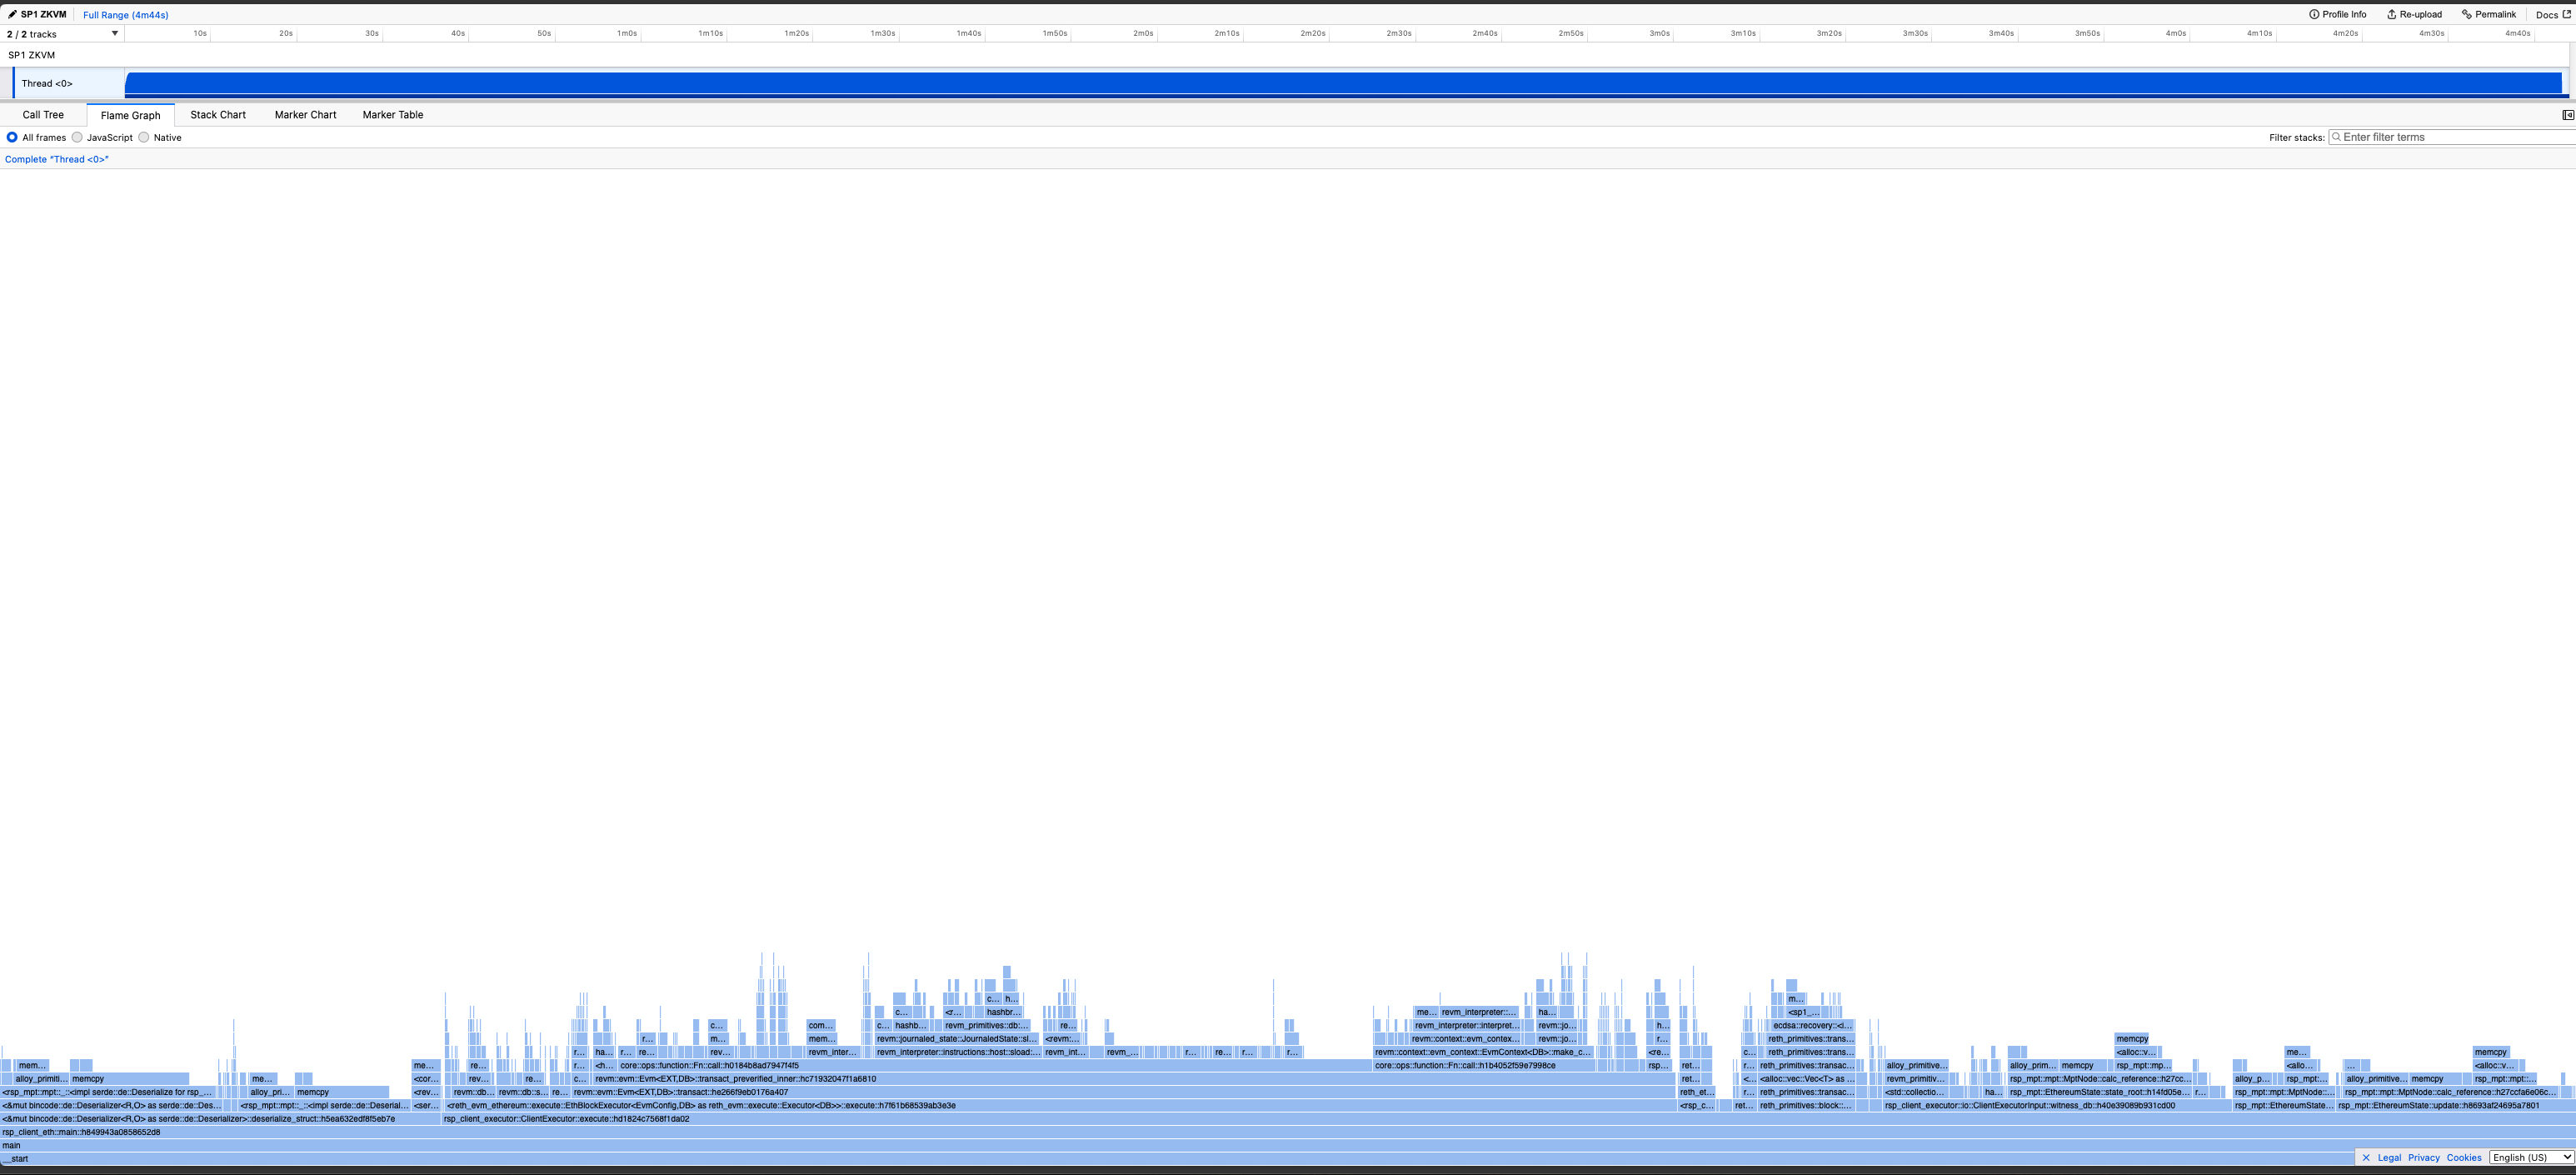
Profiling a zkVM program produces a useful visualization (example profile) which makes it easy to examine program performance and see exactly where VM cycles are being spent without needing to modify the program at all.
To profile a program, you need to:
- Enable the profiling feature for
sp1-sdkinscript/Cargo.toml - Set the env variable
TRACE_FILE=trace.jsonand then callProverClient::execute()in your script.
If you're executing a larger program (>100M cycles), you should set TRACE_SAMPLE_RATE to reduce the size of the trace file. A sample rate of 1000 means that 1 in every 1000 VM cycles is sampled. By default, every cycle is sampled.
Many examples can be found in the repo, such as this 'fibonacci' script.
Once you have your script it should look like the following:
    // Execute the program using the `ProverClient.execute` method, without generating a proof.
    let (_, report) = client.execute(ELF, stdin.clone()).run().unwrap();
As well you must enable the profiling feature on the SDK:
sp1-sdk = { version = "3.0.0", features = ["profiling"] }
The TRACE_FILE env var tells the executor where to save the profile, and the TRACE_SAMPLE_RATE env var tells the executor how often to sample the program.
A larger sample rate will give you a smaller profile, it is the number of instructions in between each sample.
The full command to profile should look something like this
TRACE_FILE=output.json TRACE_SAMPLE_RATE=100 cargo run ...
To view these profiles, we recommend Samply.
    cargo install --locked samply
    samply load output.json
Samply uses the Firefox profiler to create a nice visualization of your programs execution.

Interpreting the Profile
-
The "time" measurement in the profiler is actually the number of cycles spent, in general the less cycles for a given callframe the better.
-
The CPU usage of the program will always be constant, as its running in the VM which is single threaded.